
When I started out as a program manager about a decade ago, every timeline slide I made was built by hand in PowerPoint. There was no template that showed the customized view I wanted, so each review meant another round of manual updates. Later I moved to a timeline add-in, which saved a lot of time, but our schedules also lived in Excel and the two never really talked to each other. A single timeline still went through many iterations, and each one took anywhere from 30 minutes to a few hours.
This guide is the honest version of how to make a timeline in PowerPoint: the three built-in methods, step by step, what each is good for, and where each one breaks. If your timeline only has to exist once, any of them will do. If it has to survive next month's update, read the last two sections.
Method 1: SmartArt (five minutes, few dates)
SmartArt is the quickest way to get something on a slide. Microsoft's own steps are short (Create a timeline in PowerPoint):
- Go to Insert > SmartArt > Process and pick Basic Timeline or Circle Accent Timeline.
- Type each milestone into a [Text] placeholder, or open the Text Pane and type them as a list.
- To add a milestone, select one and use SmartArt Design > Add Shape > Add Shape After (or Before).
- Reorder with Move Up and Move Down, then pick colors and a style from the same tab.
That is the whole feature, and it shows. SmartArt spaces items evenly, so a milestone two weeks out and one eight months out sit the same distance apart. There are no bars for durations, no swimlanes, no owners and no Today line. I have used it, and it is very limited once any customization is involved. It was not built for project or program managers, and the deeper PM templates you need for a real review are not in PowerPoint at all.
Use SmartArt for a five-milestone overview where the spacing does not matter. For anything a steering committee will read as a schedule, use one of the next two methods.
Method 2: Shapes on a scale (the flexible one)
This is what most of us actually do, and it gives you a real timeline: positions that mean something, bars for durations, diamonds for milestones.
- Set the time scale first. Decide the window (say, 12 months) and how wide the usable area of the slide is. Draw a horizontal line across that width and add a small text box for each month or quarter. Write down the conversion, for example "1 month = 0.8 inch", because every shape after this depends on it.
- Add tasks as bars. Insert a rectangle for each task, set its width to the duration times your conversion, and its left edge to the start date. Use Shape Format > Size and the position fields rather than dragging, so the dates are exact.
- Add milestones as diamonds. Small diamonds on the line or above the bars, each with a label.
- Label everything in separate text boxes so you can move a label without moving its bar.
- Group by workstream. Stack bars in horizontal bands with a label at the left, one band per workstream. That is a swimlane timeline.
- Align and distribute. Select rows and use Arrange > Align so the bands line up, then add a thin vertical Today line.
The result can look exactly the way you want. The cost is that the slide does not know any dates. It only knows positions. Every date change means recalculating where a bar starts and how wide it is, and every new task pushes something else out of the way.
Of all of it, lining up the dates takes the longest. On a twenty-task program, a two-week slip in one workstream can mean moving most of the slide.
Method 3: A table as a Gantt chart (the honest one)
If you need precision more than polish, a table works surprisingly well.
- Insert a table with one column for the task name, optionally one for the owner, and then one narrow column per week or month.
- Fill the cells a task spans with a color. Use a darker cell or a symbol for milestones.
- Merge the header cells by quarter to keep the scale readable.
A table keeps everything aligned for you and is easy to edit in a hurry. It is also the least visual: long programs need a lot of tiny columns, labels get cramped, and it reads as a spreadsheet pasted into a deck. Good for a working session, less so for an executive review.
Where all three break: the second version
Building the first timeline is not the hard part. The hard part is that one schedule needs several versions.
Depending on your stakeholders, you have to simplify or elaborate. The executive sponsor wants five milestones and the one date that moved. The core team wants every task, every owner and the dependencies. Functional leads want their own workstream in detail and everyone else summarized. Taking one schedule and producing multiple versions of it was always what took me the most time, because with hand-built shapes every version is a separate copy, and every copy has to be updated by hand when the dates change.
That is the rule most how-to guides leave out: the amount of information on a timeline slide has to be adjusted to the audience. Read the room before you build, and decide what this audience needs to decide on. Hard to do when every view is its own copy of the slide.
The second way it breaks is portability. One of my more embarrassing review moments came from a timeline a colleague had built with an add-in. He had a different version of it than I did, so I could not edit the slide when a question came up live. The slide was right there, and nobody in the room could change it. Microsoft's add-in documentation is plain about why this happens: older-style COM and VSTO add-ins run only in Office on Windows, while web-based Office Add-ins run in PowerPoint on Windows, Mac and the web. If the deck is going to be edited by more than one person, check that whatever builds it is something everyone who will touch the slide can open.
How I do it now
We built PMO Pilot because we wanted the flexibility of hand-built shapes without having to recalculate positions. You paste the plan (status notes, an email or rows from Excel), review every date it read, and it draws the timeline as ordinary PowerPoint shapes. Workstreams become swimlanes. When the dates change, you paste again and it moves the bars while keeping the labels and colors you adjusted by hand.
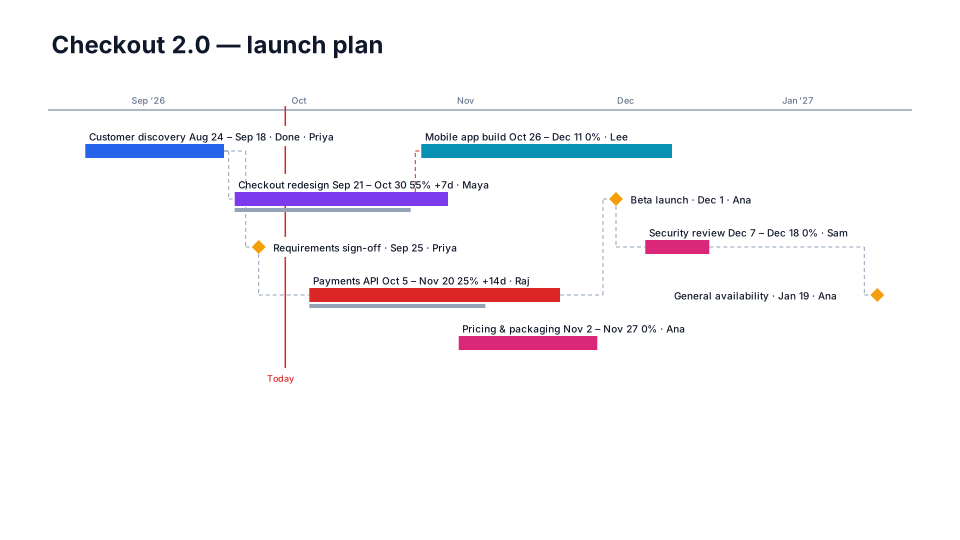
For the different versions, the data stays in one place and you choose what each slide shows: owners and status on or off per item, or one slide per workstream on the same time scale. The import guide for Excel shows the columns it reads, and the product roadmap template is a good starting point if you are building from scratch. It is a web add-in, so it runs on Windows, Mac and PowerPoint for the web, and the result is native shapes, so anyone can edit the slide even without the add-in.
| Method | Good for | Breaks when |
|---|---|---|
| SmartArt | A quick overview with a handful of milestones | Dates need real spacing, or you need bars and owners |
| Shapes on a scale | A polished, customized review slide | Dates change and every bar has to be moved by hand |
| Table | Precision in a working session | The audience is executive and needs a picture |
| Add-in from your data | Recurring reviews with several audiences | Everyone editing the deck can't open the same tool |
Before your next review
Write down who will be in the room and what each of them needs to decide. Then look at last month's timeline slide and count how many items on it that audience actually needs. If the answer is fewer than half, build the short version first and keep the detailed one as a backup slide. You'll spend less time on the slide, and the meeting will spend more time on the decisions.
More about my background on the About page.