
A milestone timeline tells a steering committee where the dates are. A Gantt chart tells the team why. One task per row, a bar for how long it runs, and the lines between bars that say "this cannot start until that finishes." The moment someone in a review asks "what is actually driving the September date," you need the second kind of slide, and PowerPoint has no button for it.
I only bring a Gantt chart into a room full of subject matter experts. That is where the bottom-up schedule gets built, and more importantly where it gets checked: does the bar on the slide match the estimate the engineer actually gave, and does it match what they expect to happen? Once that holds, the Gantt chart becomes the source for a milestone timeline, which goes to a different group entirely. Leadership, managers and external parties want the higher-level milestones, not the rows. The level of detail on the slide depends on who is in the room, and the same program gets two different slides for that reason.
This guide covers the three ways to make a Gantt chart in PowerPoint with what ships in the box, in order from quickest to most flexible, and the two things none of them can do that a real schedule needs. If you want the simpler milestone version, the companion guide on how to make a timeline in PowerPoint covers SmartArt and shapes on a scale.
What a Gantt chart on a slide has to carry
Before building one, decide which of these the audience needs, because each one costs rows and columns on a slide that only has so many:
- A task name column on the left, with the owner next to it if people will be asked about their rows.
- A time scale across the top, usually weeks for a quarter and months for a year.
- One bar per task from start to finish, and a diamond for each milestone (a task with no duration).
- Dependencies, drawn as arrows from the end of one bar to the start of the next.
- Progress, either as % complete inside the bar or a status color.
- A Today line, so the slide says when it was true.
A working-team Gantt chart needs most of these. An executive Gantt chart needs the first three and the Today line, with the rest summarized into a sentence. Decide first, then pick the method.
Method 1: A table (ten minutes, always aligned)
The quickest Gantt chart in PowerPoint is a table, and for a working session it is often the best one.
- Go to Insert > Table and create one with a column for the task name, one for the owner if you need it, and then one narrow column per week or month in the window you are showing.
- Type the task names down the first column, one per row.
- For each task, select the cells from its start period to its finish period and fill them with a color (Table Design > Shading). That is the bar.
- Milestones get a single cell with a darker fill or a diamond symbol (Insert > Symbol).
- Merge the header cells above each quarter or month group so the scale reads at a glance, and set the period columns to the same width.
- Add a Today marker by shading the column header for the current period.
The table keeps every row and column aligned for you, which is the whole reason it is fast. The cost is resolution and looks: a task that starts on the 20th and one that starts on the 1st fill the same cell, a year at week resolution is 52 tiny columns, and there is no way to draw a dependency arrow between cells without laying shapes on top. It reads as a spreadsheet pasted into a deck because that is what it is.
Method 2: A stacked bar chart (the one that updates from data)
This is the method that is closest to a real Gantt chart, and it is the one most people do not know about. Excel has no built-in Gantt chart type (Microsoft says so on its own Gantt chart in Excel page and points you at templates instead), but a stacked bar chart with the first series made invisible behaves like one, and PowerPoint charts carry their own data sheet.
- Go to Insert > Chart > Bar > Stacked Bar. A small data sheet opens.
- Replace the sample data with three columns: task name, start date, and duration in days. Delete any extra series columns.
- The chart now shows two stacked segments per task: one from the chart's origin to the start date, and one for the duration. Click the start-date segment (the first series) and set its fill to No fill and its outline to No line. Only the duration bars remain, each beginning on its start date.
- Tasks come out bottom to top. Right-click the vertical axis, choose Format Axis, and turn on Categories in reverse order so the first task is at the top.
- Right-click the horizontal axis, choose Format Axis, and set the minimum bound to the serial number of your first date (type the date in an empty Excel cell and format it as a number to read it; a date in 2026 is a number in the 46,000s). Set the major unit to 7 for weeks or about 30 for months, and the number format to a date format.
- Color the duration series by workstream if you want lanes, and add data labels for the task names if the axis labels are too cramped.
The payoff is step 7, next month: select the chart, go to Chart Design > Edit Data, change the start date or duration in the sheet, and the bar moves. Microsoft's page on changing the data in an existing chart covers both the in-PowerPoint sheet and editing the data in Excel. This is the only hand-built method where the slide knows what a date is.
Where it breaks: milestones, dependencies and anything the chart engine does not understand. A milestone is a bar of zero length, which is invisible, so you fake it with a one-day bar or a separate scatter series, and neither survives a casual edit by a colleague. Dependency arrows have to be drawn as shapes on top of the chart, and they do not move when the bars do. Baselines need a second set of hidden series. And the chart's own formatting fights you: the gap width, the axis bounds and the series colors all reset in ways that are hard to predict when you paste the chart into a deck with a different theme. It is a good method for twenty tasks and one audience. It is a frustrating one for a program review that changes every month.
Method 3: Shapes (the flexible one)
A Gantt chart drawn from shapes is the same build as a shape timeline: a time scale across the top, a rectangle per task sized by arithmetic, diamonds for milestones, and text boxes for labels. The steps are in the timeline guide; what changes for a Gantt chart is that every task gets its own row with a name at the left, the rows are spaced evenly with Shape Format > Align > Distribute Vertically, and dependencies are drawn with Insert > Shapes > Elbow Connector, which snaps to the bars at each end and follows them when a single bar is dragged.
The Gantt charts I have maintained by hand mostly lived in Microsoft Project, and I have watched teams keep the same thing in Jira, Monday.com, Wrike and ClickUp, each with its own version of a timeline view. Those are hard to keep up for a reason that has nothing to do with the software: every person on the program uses the tool differently and has a different picture of what the schedule should look like, so finding a template everyone will accept is a project in itself, and keeping it maintained is another one. Then the leadership review comes around and the schedule has to exist in PowerPoint as well. Whatever platform the original lives in, the slide is a manual export, and from that point on there are two copies that drift apart. That gap, between the tool where the schedule is maintained and the deck where it is reviewed, is the one I ended up building an add-in to close.
Where it breaks: the connectors follow a bar you drag, but nothing else does. Move a task three weeks and its label, its % complete fill and the rows beneath it that depended on it all need to be touched by hand. A twenty-row Gantt chart from shapes is three to four hundred objects on a slide, and a schedule change on a Friday afternoon means a Saturday morning.
The two things none of them can do
Dependencies that mean something. On a slide, an arrow from one bar to another is decoration. In a schedule it is a rule: when the predecessor slips, the successor slips. Microsoft Project calls the chain of those rules that sets the finish date the critical path, and its own documentation on showing the critical path explains the idea in one sentence: if any task on that chain slips, the project finish slips. None of the three PowerPoint methods can compute that. You can draw the critical path in red if you already know it from the schedule, but you have to re-draw it every time the schedule changes, and it changes whenever a duration on the chain does.
On a development program I work this out from the bottom-up timeline rather than from the slide. I pick out up to five candidate critical paths through the schedule, then look at each one for risk: which of its tasks could actually slip, and what milestone would that push out. In practice it comes down to one or two items that could move a milestone into the future. Those go on the slide, outlined and named. Everything else is left off, because it does not change the answer. It is the Pareto principle applied to a schedule: a very small number of tasks carry nearly all the risk, and in a leadership presentation the job is to put those few in front of the room, not to prove how many rows the plan has.
A baseline. A Gantt chart that only shows the current plan hides the one thing a review is for, which is whether the plan moved. The honest version shows the baseline bar in gray under the current bar so the slip is visible as a gap. With a table that doubles the rows, with a chart it is two more hidden series, and with shapes it is another hundred objects.
The advice I disagree with
Two pieces of common advice point in opposite directions, and I take the opposite side on both.
The first is to show every task so nothing is hidden from the reviewers. Don't. You will drown everybody in information, and the one or two tasks that matter will be sitting in row 40 next to the ones that don't. A review that cannot find the risk on the slide is a review that did not happen.
The second is to go easy on color and keep the chart muted and uniform. I would do the reverse. Use a lot of different colors, and spend time on the style. You have very limited time to present a high-level summary, and color is the fastest way to make the slide sort itself: this workstream, that one, the bar that is at risk. Looks are not decoration here, they are how the room reads the chart before you have finished your first sentence.
How I do it now
We built PMO Pilot to get out of the three methods above without giving up native shapes. You paste the plan (rows from Excel, an export from a scheduling tool, or the status notes themselves), review every date it read, and it draws a Gantt chart as ordinary PowerPoint rectangles, diamonds and lines. One task per row with a name column, durations and % complete is the Detailed Gantt look, which is on the free plan; the Engineering Gantt adds owners and dependency lines on a weekly scale.
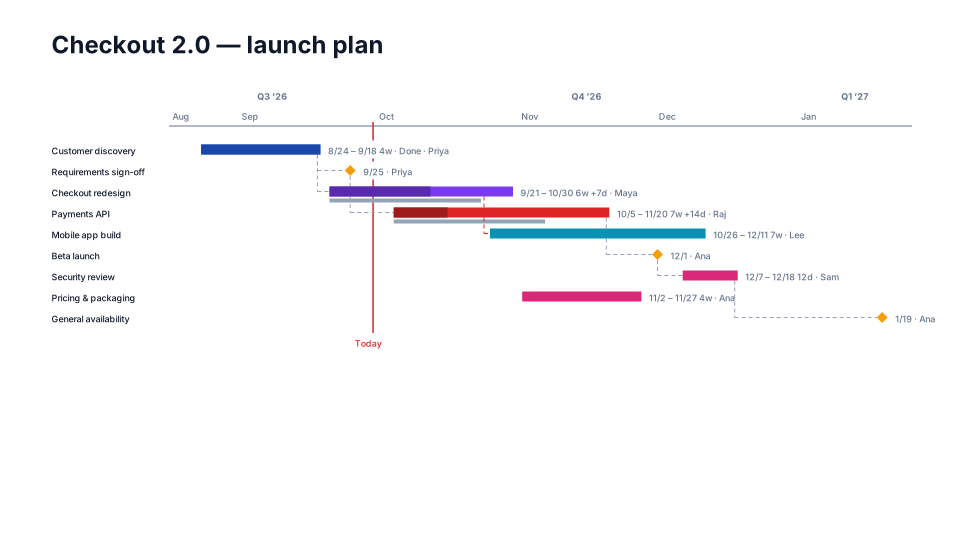
The dependencies are real: it reads predecessor columns (Finish to Start, Start to Start, Finish to Finish and Start to Finish), follows them back from the finish and outlines the driving chain in red, and when a predecessor moves in next month's paste the chart redraws while keeping the labels and colors you changed by hand. Baselines are a saved snapshot, shown under the current bar with the slip labeled. If the schedule lives in Microsoft Project, the MS Project to PowerPoint page shows the export that keeps predecessors, resources and % complete; the Excel page covers a plain spreadsheet with task, start, finish and predecessor columns. Nothing is mapped; it recognizes the column names.
Tomorrow
Take the Gantt chart from your last review and, next to it, open the schedule it was supposed to represent. Mark every bar whose dates differ and every dependency that is on one and not the other. If the count is zero, your method works and you should keep it. If it is not, decide whether you want to spend next month's Friday afternoon fixing that by hand, or ten minutes checking the dates a tool read for you. The free plan at getpmopilot.com builds unlimited timelines and Gantt charts from an Excel or CSV plan with no account, so the comparison costs you nothing but the ten minutes.
And whichever method you use, remember who the stakeholders are before you decide what goes on the slide. Leaving out the rows most of the audience will not find interesting is not hiding anything. It is what makes the discussion about the Gantt chart a successful one.