Free Gantt chart maker and template for PowerPoint
Build a Gantt chart online and download it as an editable PowerPoint slide. This free Gantt chart generator starts from a ready-made Gantt chart template: replace the sample tasks with yours, or paste them from Excel. No sign-up, and your plan stays in your browser.
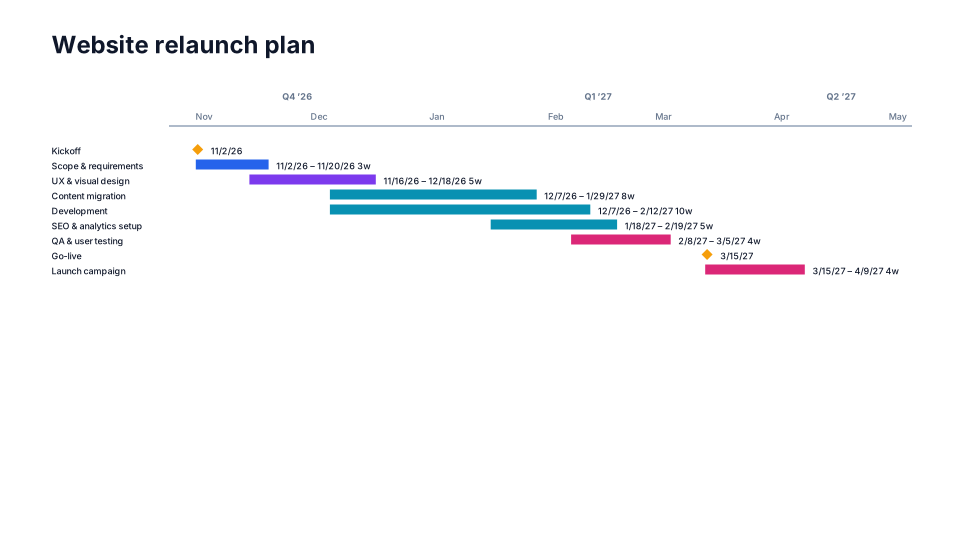
Your plan
| Task | Start | End | Lane | MS | Remove |
|---|---|---|---|---|---|
Paste from Excel or upload a file
Want this from messy notes, with updates that keep your edits?
PMO Pilot works inside PowerPoint: paste status notes, an email or an Excel plan, and when dates change it updates the slide without undoing your tweaks. 80 looks and 53 program diagrams.
How to make a Gantt chart for PowerPoint
- List your tasks with start and end dates, or paste them from Excel. Tick Milestone for a single-date event such as a go-live.
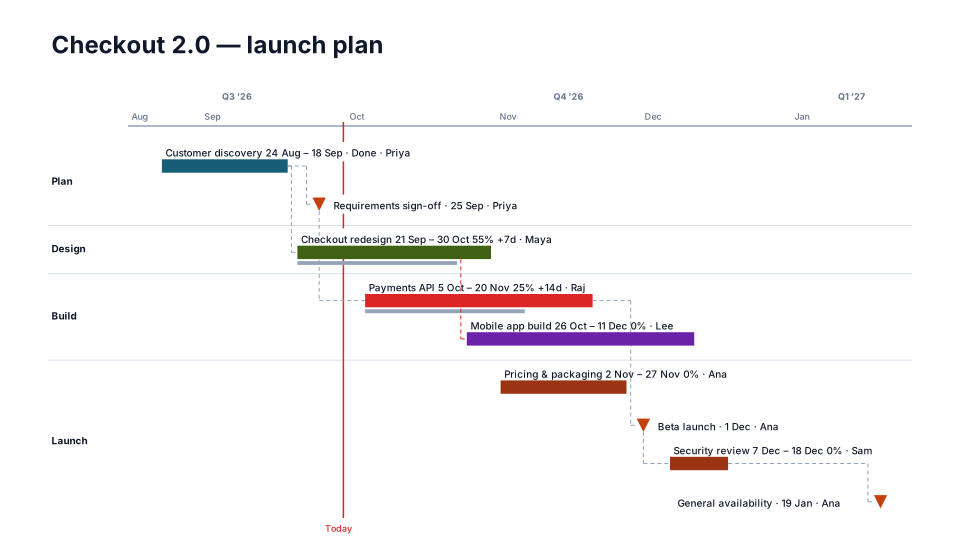
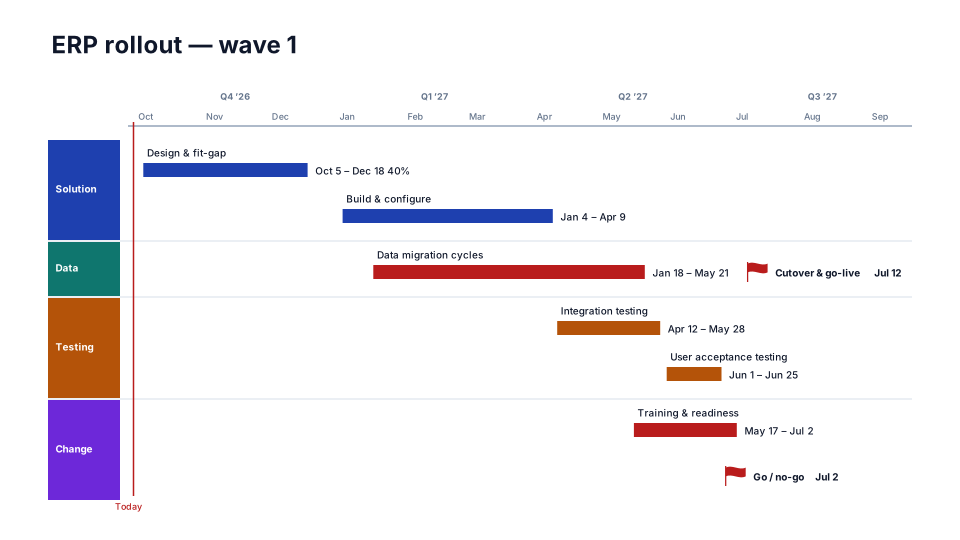
- Add a lane (team, phase or owner) to group related tasks.
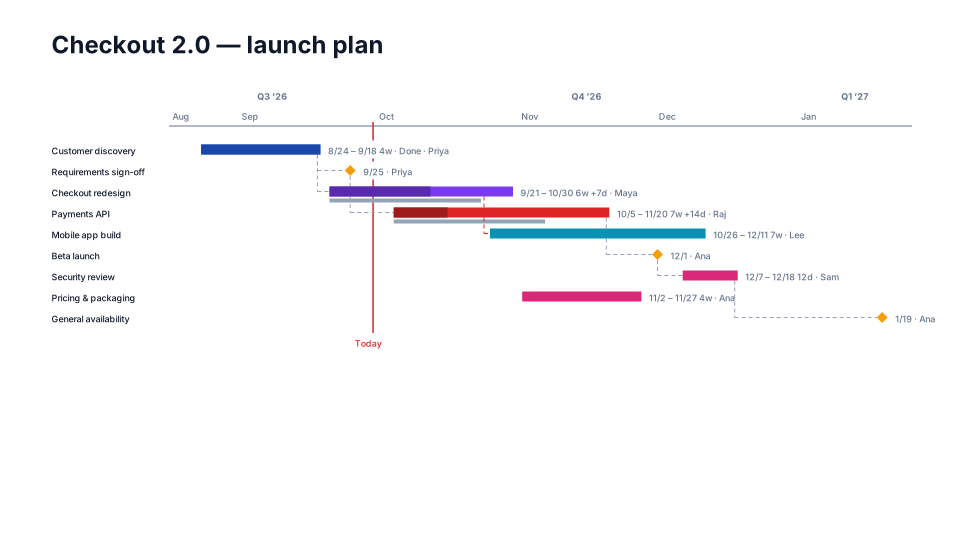
- Keep the Detailed Gantt look, with one task per row and the dates beside each bar, or pick another free look.
- Press Download PowerPoint. Every bar and label in the file is a native, editable shape.
Tip: Keep a Gantt chart for a slide to about 15–25 tasks. For a bigger plan, show the phases on one slide and each workstream on its own.
Questions
What is a Gantt chart?
A Gantt chart lists the tasks of a project and draws each one as a bar along a calendar, so you can see what happens when, what overlaps and when each milestone lands. It's the most common way to show a project schedule.
Is there a free Gantt chart template for PowerPoint?
Yes. Download one of the ready-made Gantt chart templates, or make your own here and download it. Both are free .pptx files made of native PowerPoint shapes.
Can I make a Gantt chart from Excel?
Yes. Copy the task rows from Excel, header row included, and paste them, or upload a .csv or .xlsx file. Task, Start and End columns are found by name; Workstream, Phase or Owner become lanes.
Do you see or store my plan?
No. The maker runs entirely in your browser. What you type, paste or upload is never sent to a server, and nothing is stored after you close the page.
Can I show dependencies, % complete or baselines?
Not in the free maker, which draws tasks, milestones and lanes. The PMO Pilot add-in for PowerPoint reads predecessors, % complete and baseline dates from your Excel or MS Project export, draws dependency arrows, progress and slippage, and can outline the critical path.
What's the difference between a Gantt chart and a timeline?
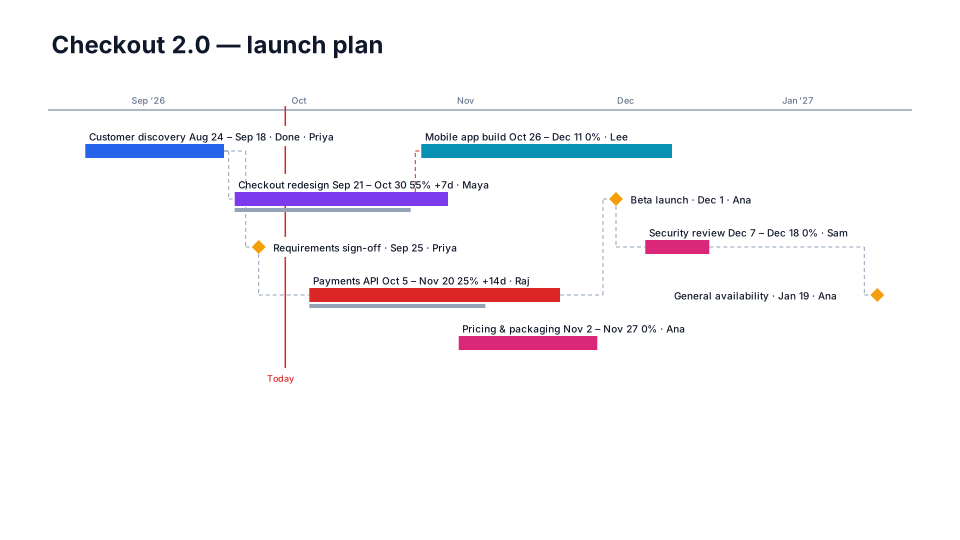
A timeline shows phases and key milestones at a glance, usually for leadership. A Gantt chart shows every task as a bar against dates, for the people doing the work. The same plan can be drawn either way: switch looks here to compare.
Can I edit the Gantt chart in PowerPoint?
Yes. Every bar, milestone, label and line is a native PowerPoint shape, not a picture, so you can change text, colors, fonts and positions like anything else on a slide.
Free Gantt chart templates for PowerPoint
Every one is a free, editable .pptx download, with a short guide on when to use it. See also the Gantt chart templates page. All 133 templates.