
PI Planning template for PowerPoint (SAFe)
A PI planning timeline shows one SAFe Planning Interval on one slide: a lane per agile team, each team's features sprint by sprint, and the PI milestones such as the system demo and the release. Use it to open PI planning, to report against the plan at the PI review, and to show leaders which team delivers what, and when.
Download (.pptx, 14 KB) Fill it from your notes in PowerPoint
The download is the slide above, made of native PowerPoint shapes you can edit. No sign-up. To draw it from your own dates in the browser, use the free timeline maker. PMO Pilot, the PowerPoint add-in, fills it from notes or a spreadsheet and is free to install.
What's on the slide
- One lane per team, named the way your ART names them
- Sprints (iterations) as bars, labelled with the feature each delivers
- PI milestones as hexagons: the PI demo and the release
- Week start dates under the months, so sprint boundaries line up with the scale
- The PI's dates on a solid band across the top
When to use it
SAFe PI planning and PI reviews: what each team delivers, sprint by sprint, in one Planning Interval.
How to make it in PMO Pilot
- Put the team in the Owner column (this look gives each owner a lane), features as tasks, and PI objectives and demos as milestones.
- Pick PI Planning (SAFe).
- Under Timescale & dates, set Timeline starts and ends to On dates I choose and enter the PI's first and last day.
Best for
Release train engineers, Scrum of scrums.
Bring your data from…
- ExcelExcel to PowerPoint timeline
- Microsoft ProjectMS Project to PowerPoint Gantt chart in a few minutes
- JiraJira to PowerPoint roadmap
- SmartsheetSmartsheet to PowerPoint timeline with baselines and dependencies
- AsanaAsana to PowerPoint timeline
Column names are matched as each tool exports them: no mapping step.
Questions
How long is a PI, and how many sprints does the slide show?
SAFe calls the PI a Planning Interval and says it typically lasts 8 to 12 weeks. The usual pattern is four development iterations followed by one Innovation and Planning (IP) iteration, so with two-week sprints the slide covers about 10 weeks. Set the timeline's start and end to the PI's dates so the scale shows exactly that window.
Is this the same as the ART planning board?
No. The planning board from the PI planning event shows features, their delivery dates, dependencies between teams and milestones, usually on sticky notes. This slide is the clean version for people who weren't in the room. Add cross-team dependencies as relationships in Edit and they're drawn as arrows.
Where do PI objectives go?
Make each team's committed objectives milestones in that team's lane, dated to the sprint they land in. SAFe also has uncommitted objectives, planned but not promised because of unknowns; give those a different milestone shape or a lighter color so the difference shows on the slide.
Can I build it from a Jira export?
Yes. Export the issues to CSV with Summary, Assignee, Due date, Sprint and Parent summary, then use Upload Excel / CSV in Create; Jira's column names are read as they are. This look puts one lane per owner, so put the team name in the Assignee column, or set Style → Rows & spacing → Swimlanes to By workstream to lane by epic.
More Agile & delivery templates
Part of Agile and PI planning templates, with a guide to which one fits which meeting. All 80 timeline looks, each a free .pptx download.
- Free
Agile Sprints
Agile & delivery 
Delivery Tracker
Agile & delivery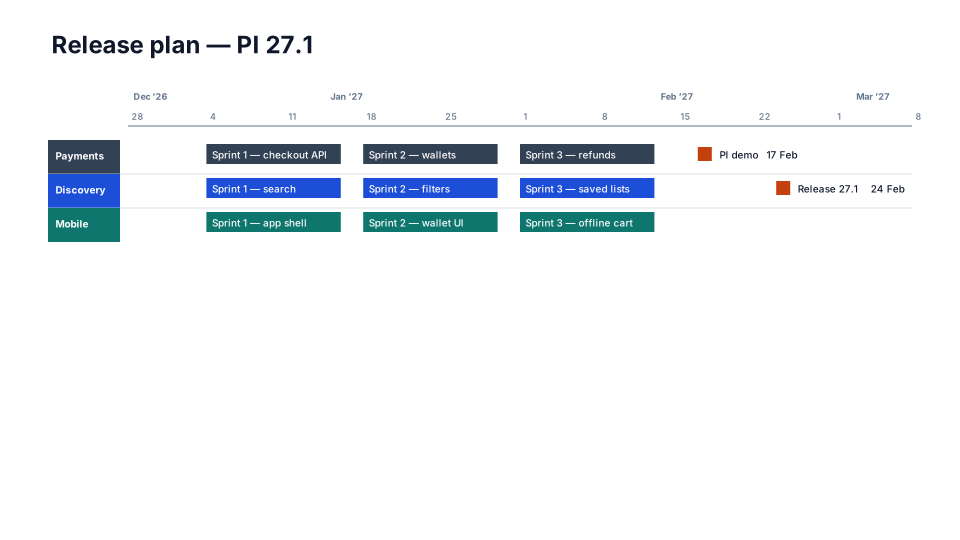
Sprint Calendar
Agile & delivery
Epic Roadmap
Agile & delivery
From the blog
How to make a Gantt chart in PowerPoint (and keep it in sync)
Three ways to build a Gantt chart in PowerPoint by hand, a table, a stacked bar chart or shapes, what each can and cannot show, and how to keep it in…
How to make a timeline in PowerPoint (and keep it current)
Three ways to build a project timeline in PowerPoint, SmartArt, shapes and a table, step by step, plus where each breaks once the dates start moving.
How to present a schedule slip to a steering committee
A project manager's method for showing a schedule slip to executives: one slide, the old date next to the new one, the cause, the options and the…